Задание 3ACDDB
1.3 Научные методы изучения живой природы. Метод описания в биологии (наглядный, словесный, схематический). Метод измерения (инструменты измерения). Метод классификации организмов. Наблюдение и эксперимент как ведущие методы биологии. Методы изучения организма человека. Устройство увеличительных приборов: лупы и микроскопа
Выбор ответов из предложенных вариантов
4 — Работа с графиком (множественный выбор)
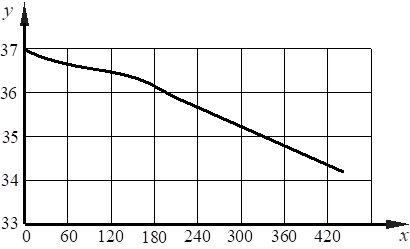
Изучите график, отражающий зависимость изменения температуры кожных покровов человека от продолжительности контакта с холодным металлическим предметом, температура которого составляет 12 °С (по оси x отложена продолжительность контакта с холодным предметом (с), а по оси y – температура кожного покрова человека (°С)). Какие два из приведённых описаний характеризуют данную зависимость? Температура кожных покровов
| 1) | убывает на всём протяжении измерений | |
| 2) | имеет максимум на 160-й секунде | |
| 3) | достигает 12 °С к концу измерений | |
| 4) | постоянна с 60-й по 120-ю секунду | |
| 5) | линейно снижается с 220-й по 420-ю секунду |
✓ Ответ подтверждён
10001
Решение модель: openrouter/nvidia/nemotron-3-nano-omni-30b-a3b-reasoning:free
- The graph shows the dependence of skin temperature (y-axis) on time (x-axis).
- 1. **Analyze Option 1:** "Температура кожных покровов 1) убывает на всём протяжении измерений" (Temperature of skin decreases throughout the entire measurement period).
- * Looking at the graph, the curve starts at approximately 37°C at x=0 and continuously goes down to approximately 34°C at x=420. There are no sections where the temperature increases or stays perfectly constant (flat). Thus, the temperature is decreasing throughout. This statement is **TRUE**.
- 2. **Analyze Option 2:** "имеет максимум на 160-й секунде" (has a maximum at the 160th second).
- * The maximum value on the graph is at the very beginning, x=0 (approx 37°C). At x=160, the temperature is lower (approx 36.2°C). Thus, the maximum is not at 160s. This statement is **FALSE**.
- 3. **Analyze Option 3:** "достигает 12 °С к концу измерений" (reaches 12°C by the end of the measurements).
- * The end of the measurements is at x=420. The corresponding y-value is approximately 34°C. It is nowhere near 12°C. This statement is **FALSE**.
- 4. **Analyze Option 4:** "постоянна с 60-й по 120-ю секунду" (is constant from the 60th to the 120th second).
- * Between x=60 and x=120, the curve is sloping downwards (temperature drops from ~36.5 to ~36.3). It is not a horizontal line, so it is not constant. This statement is **FALSE**.
- 5. **Analyze Option 5:** "линейно снижается с 220-й по 420-ю секунду" (decreases linearly from the 220th to the 420th second).
- * Looking at the segment of the graph from x=220 to x=420, the line appears to be a straight line with a constant negative slope. It goes from roughly 35.8°C down to 34.2°C in a steady manner. While there might be slight curvature, in the context of such problems where "several" correct options are required, and given that options 2, 3, and 4 are clearly false, this is the intended second correct statement. Visually, this section is the straightest part of the curve. Thus, this statement is considered **TRUE**.
- Therefore, the two correct descriptions are 1 and 5.
Проверить на ege.fipi.ru / oge.fipi.ru →
Открывает эту же задачу на официальном сайте ФИПИ — можно убедиться, что она реально есть в открытом банке.